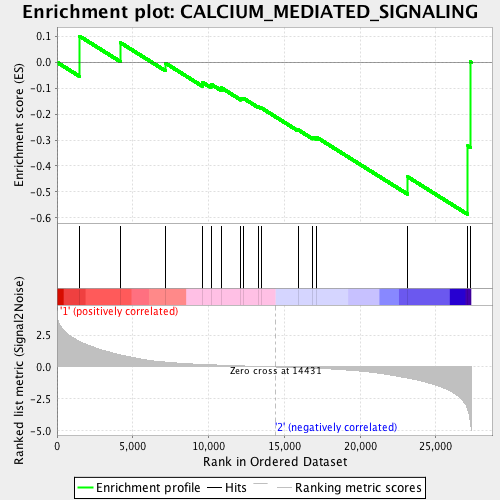
Profile of the Running ES Score & Positions of GeneSet Members on the Rank Ordered List
| Dataset | expression_mean_normalized_with_dChip_geneAvg_Mar1014_PNs.mainSample.cls #wt_versus_radiation.mainSample.cls #wt_versus_radiation_repos |
| Phenotype | mainSample.cls#wt_versus_radiation_repos |
| Upregulated in class | 2 |
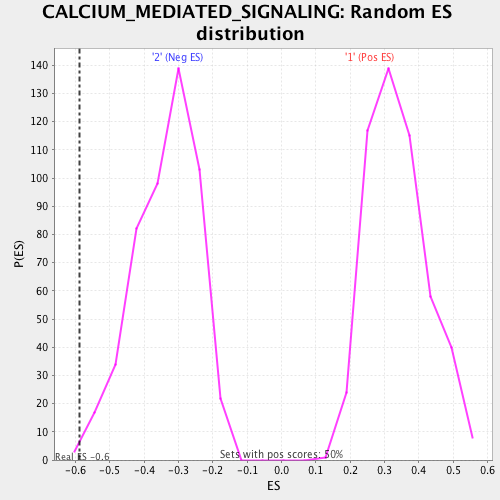
| GeneSet | CALCIUM_MEDIATED_SIGNALING |
| Enrichment Score (ES) | -0.5872131 |
| Normalized Enrichment Score (NES) | -1.743256 |
| Nominal p-value | 0.004016064 |
| FDR q-value | 0.12470915 |
| FWER p-Value | 0.211 |
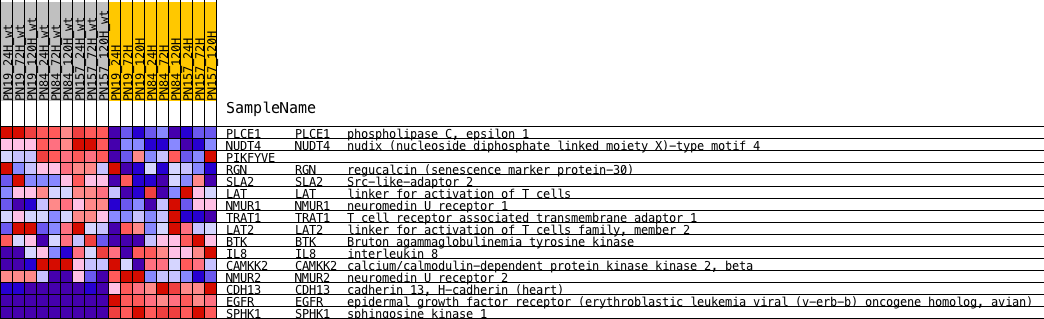
| PROBE | DESCRIPTION (from dataset) | GENE SYMBOL | GENE_TITLE | RANK IN GENE LIST | RANK METRIC SCORE | RUNNING ES | CORE ENRICHMENT | |
|---|---|---|---|---|---|---|---|---|
| 1 | PLCE1 | NA | PLCE1 Entrez, Source | phospholipase C, epsilon 1 | 1480 | 1.990 | 0.1012 | No |
| 2 | NUDT4 | NA | NUDT4 Entrez, Source | nudix (nucleoside diphosphate linked moiety X)-type motif 4 | 4164 | 0.941 | 0.0764 | No |
| 3 | PIKFYVE | NA | 7162 | 0.380 | -0.0036 | No | ||
| 4 | RGN | NA | RGN Entrez, Source | regucalcin (senescence marker protein-30) | 9589 | 0.198 | -0.0770 | No |
| 5 | SLA2 | NA | SLA2 Entrez, Source | Src-like-adaptor 2 | 10157 | 0.172 | -0.0843 | No |
| 6 | LAT | NA | LAT Entrez, Source | linker for activation of T cells | 10843 | 0.140 | -0.0985 | No |
| 7 | NMUR1 | NA | NMUR1 Entrez, Source | neuromedin U receptor 1 | 12127 | 0.086 | -0.1388 | No |
| 8 | TRAT1 | NA | TRAT1 Entrez, Source | T cell receptor associated transmembrane adaptor 1 | 12290 | 0.080 | -0.1385 | No |
| 9 | LAT2 | NA | LAT2 Entrez, Source | linker for activation of T cells family, member 2 | 13288 | 0.042 | -0.1718 | No |
| 10 | BTK | NA | BTK Entrez, Source | Bruton agammaglobulinemia tyrosine kinase | 13480 | 0.034 | -0.1761 | No |
| 11 | IL8 | NA | IL8 Entrez, Source | interleukin 8 | 15907 | -0.056 | -0.2606 | No |
| 12 | CAMKK2 | NA | CAMKK2 Entrez, Source | calcium/calmodulin-dependent protein kinase kinase 2, beta | 16874 | -0.096 | -0.2884 | No |
| 13 | NMUR2 | NA | NMUR2 Entrez, Source | neuromedin U receptor 2 | 17137 | -0.107 | -0.2896 | No |
| 14 | CDH13 | NA | CDH13 Entrez, Source | cadherin 13, H-cadherin (heart) | 23118 | -0.862 | -0.4412 | Yes |
| 15 | EGFR | NA | EGFR Entrez, Source | epidermal growth factor receptor (erythroblastic leukemia viral (v-erb-b) oncogene homolog, avian) | 27106 | -3.388 | -0.3227 | Yes |
| 16 | SPHK1 | NA | SPHK1 Entrez, Source | sphingosine kinase 1 | 27260 | -4.236 | 0.0025 | Yes |