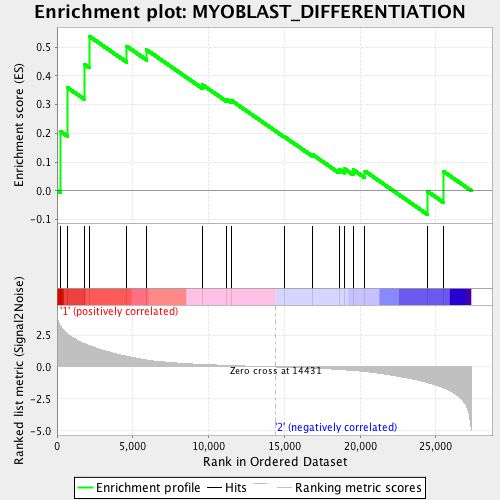
Profile of the Running ES Score & Positions of GeneSet Members on the Rank Ordered List
| Dataset | expression_mean_normalized_with_dChip_geneAvg_Mar1014_PNs.mainSample.cls #wt_versus_radiation.mainSample.cls #wt_versus_radiation_repos |
| Phenotype | mainSample.cls#wt_versus_radiation_repos |
| Upregulated in class | 1 |
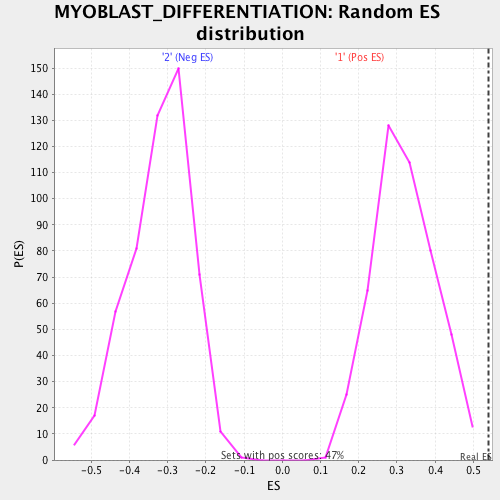
| GeneSet | MYOBLAST_DIFFERENTIATION |
| Enrichment Score (ES) | 0.5380758 |
| Normalized Enrichment Score (NES) | 1.6897852 |
| Nominal p-value | 0.0 |
| FDR q-value | 0.059115306 |
| FWER p-Value | 0.31 |
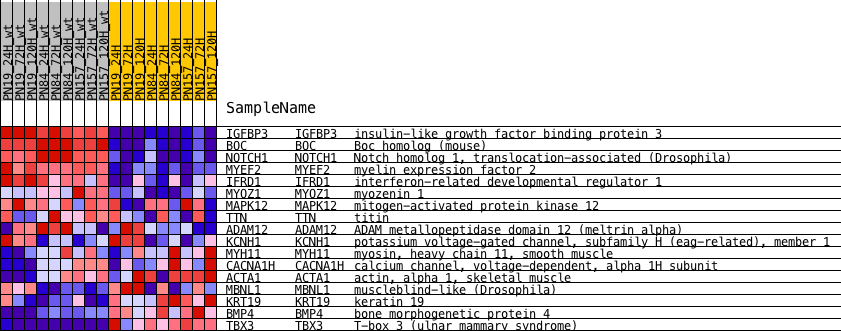
| PROBE | DESCRIPTION (from dataset) | GENE SYMBOL | GENE_TITLE | RANK IN GENE LIST | RANK METRIC SCORE | RUNNING ES | CORE ENRICHMENT | |
|---|---|---|---|---|---|---|---|---|
| 1 | IGFBP3 | NA | IGFBP3 Entrez, Source | insulin-like growth factor binding protein 3 | 206 | 3.262 | 0.2073 | Yes |
| 2 | BOC | NA | BOC Entrez, Source | Boc homolog (mouse) | 707 | 2.567 | 0.3581 | Yes |
| 3 | NOTCH1 | NA | NOTCH1 Entrez, Source | Notch homolog 1, translocation-associated (Drosophila) | 1777 | 1.838 | 0.4400 | Yes |
| 4 | MYEF2 | NA | MYEF2 Entrez, Source | myelin expression factor 2 | 2111 | 1.673 | 0.5381 | Yes |
| 5 | IFRD1 | NA | IFRD1 Entrez, Source | interferon-related developmental regulator 1 | 4582 | 0.844 | 0.5033 | No |
| 6 | MYOZ1 | NA | MYOZ1 Entrez, Source | myozenin 1 | 5917 | 0.543 | 0.4902 | No |
| 7 | MAPK12 | NA | MAPK12 Entrez, Source | mitogen-activated protein kinase 12 | 9600 | 0.198 | 0.3684 | No |
| 8 | TTN | NA | TTN Entrez, Source | titin | 11179 | 0.124 | 0.3188 | No |
| 9 | ADAM12 | NA | ADAM12 Entrez, Source | ADAM metallopeptidase domain 12 (meltrin alpha) | 11530 | 0.109 | 0.3132 | No |
| 10 | KCNH1 | NA | KCNH1 Entrez, Source | potassium voltage-gated channel, subfamily H (eag-related), member 1 | 14996 | -0.021 | 0.1877 | No |
| 11 | MYH11 | NA | MYH11 Entrez, Source | myosin, heavy chain 11, smooth muscle | 16828 | -0.094 | 0.1268 | No |
| 12 | CACNA1H | NA | CACNA1H Entrez, Source | calcium channel, voltage-dependent, alpha 1H subunit | 18607 | -0.194 | 0.0745 | No |
| 13 | ACTA1 | NA | ACTA1 Entrez, Source | actin, alpha 1, skeletal muscle | 18963 | -0.223 | 0.0762 | No |
| 14 | MBNL1 | NA | MBNL1 Entrez, Source | muscleblind-like (Drosophila) | 19529 | -0.273 | 0.0735 | No |
| 15 | KRT19 | NA | KRT19 Entrez, Source | keratin 19 | 20314 | -0.357 | 0.0683 | No |
| 16 | BMP4 | NA | BMP4 Entrez, Source | bone morphogenetic protein 4 | 24438 | -1.222 | -0.0021 | No |
| 17 | TBX3 | NA | TBX3 Entrez, Source | T-box 3 (ulnar mammary syndrome) | 25487 | -1.638 | 0.0674 | No |