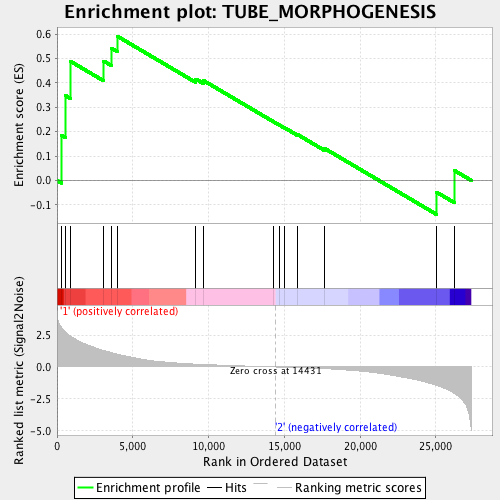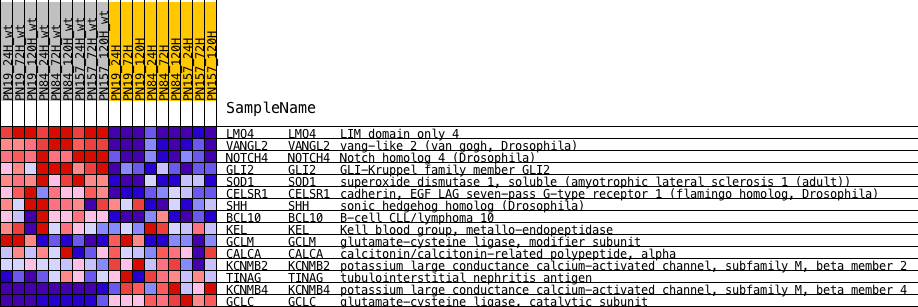
Profile of the Running ES Score & Positions of GeneSet Members on the Rank Ordered List
| Dataset | expression_mean_normalized_with_dChip_geneAvg_Mar1014_PNs.mainSample.cls #wt_versus_radiation.mainSample.cls #wt_versus_radiation_repos |
| Phenotype | mainSample.cls#wt_versus_radiation_repos |
| Upregulated in class | 1 |
| GeneSet | TUBE_MORPHOGENESIS |
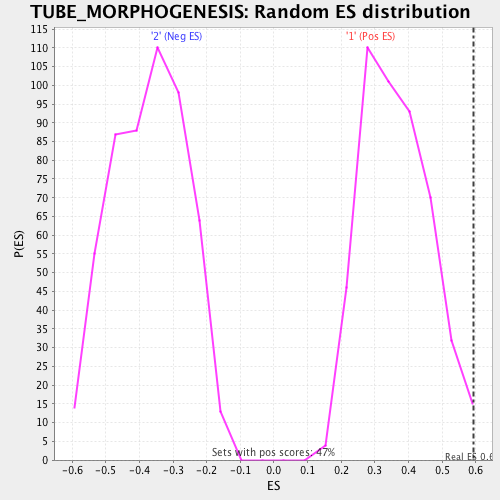
| Enrichment Score (ES) | 0.5917986 |
| Normalized Enrichment Score (NES) | 1.6311908 |
| Nominal p-value | 0.006369427 |
| FDR q-value | 0.07369311 |
| FWER p-Value | 0.468 |

| PROBE | DESCRIPTION (from dataset) | GENE SYMBOL | GENE_TITLE | RANK IN GENE LIST | RANK METRIC SCORE | RUNNING ES | CORE ENRICHMENT | |
|---|---|---|---|---|---|---|---|---|
| 1 | LMO4 | NA | LMO4 Entrez, Source | LIM domain only 4 | 291 | 3.100 | 0.1858 | Yes |
| 2 | VANGL2 | NA | VANGL2 Entrez, Source | vang-like 2 (van gogh, Drosophila) | 553 | 2.710 | 0.3479 | Yes |
| 3 | NOTCH4 | NA | NOTCH4 Entrez, Source | Notch homolog 4 (Drosophila) | 877 | 2.408 | 0.4886 | Yes |
| 4 | GLI2 | NA | GLI2 Entrez, Source | GLI-Kruppel family member GLI2 | 3079 | 1.284 | 0.4894 | Yes |
| 5 | SOD1 | NA | SOD1 Entrez, Source | superoxide dismutase 1, soluble (amyotrophic lateral sclerosis 1 (adult)) | 3584 | 1.126 | 0.5423 | Yes |
| 6 | CELSR1 | NA | CELSR1 Entrez, Source | cadherin, EGF LAG seven-pass G-type receptor 1 (flamingo homolog, Drosophila) | 3960 | 0.998 | 0.5918 | Yes |
| 7 | SHH | NA | SHH Entrez, Source | sonic hedgehog homolog (Drosophila) | 9147 | 0.222 | 0.4160 | No |
| 8 | BCL10 | NA | BCL10 Entrez, Source | B-cell CLL/lymphoma 10 | 9651 | 0.195 | 0.4099 | No |
| 9 | KEL | NA | KEL Entrez, Source | Kell blood group, metallo-endopeptidase | 14298 | 0.004 | 0.2401 | No |
| 10 | GCLM | NA | GCLM Entrez, Source | glutamate-cysteine ligase, modifier subunit | 14683 | -0.009 | 0.2266 | No |
| 11 | CALCA | NA | CALCA Entrez, Source | calcitonin/calcitonin-related polypeptide, alpha | 15001 | -0.021 | 0.2163 | No |
| 12 | KCNMB2 | NA | KCNMB2 Entrez, Source | potassium large conductance calcium-activated channel, subfamily M, beta member 2 | 15886 | -0.055 | 0.1875 | No |
| 13 | TINAG | NA | TINAG Entrez, Source | tubulointerstitial nephritis antigen | 17657 | -0.132 | 0.1310 | No |
| 14 | KCNMB4 | NA | KCNMB4 Entrez, Source | potassium large conductance calcium-activated channel, subfamily M, beta member 4 | 25047 | -1.437 | -0.0484 | No |
| 15 | GCLC | NA | GCLC Entrez, Source | glutamate-cysteine ligase, catalytic subunit | 26243 | -2.083 | 0.0398 | No |

